Tableau Training
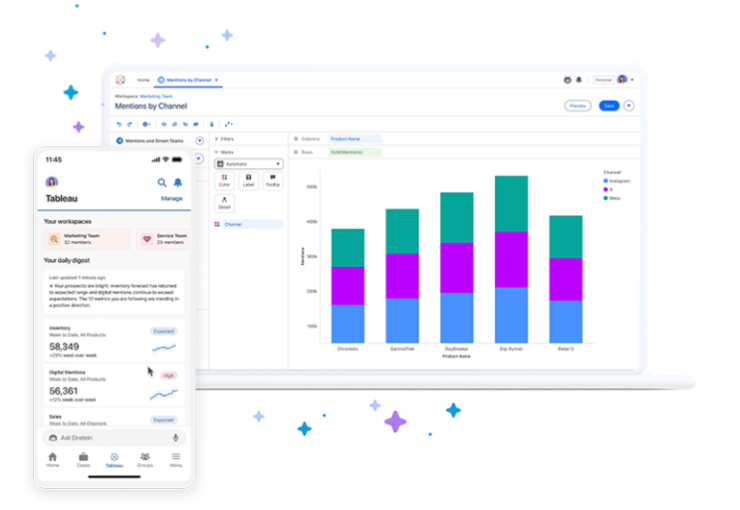
Tableau is a powerful data visualization and business intelligence (BI) tool that helps people and organizations understand their data through interactive and shareable dashboards.
Tableau allows you to turn rows of raw data (from Excel, databases, or cloud services) into easy-to-understand graphs, charts, and dashboards — with no coding required.
Course Content Overview – One-on-One Tableau Training
In the Foundations (Beginner to Intermediate) level, you’ll develop a strong understanding of Tableau’s user interface and core features. We’ll cover how to connect to various data sources, navigate the Tableau workspace, and build basic visualizations such as bar charts, line graphs, and maps. You’ll also learn how to use dimensions and measures effectively, apply filters, and create simple dashboards. By the end of this section, you’ll be able to present your data clearly and interactively using Tableau’s drag-and-drop functionality.
At the Advanced (Intermediate to Advanced) level, you’ll explore calculated fields, table calculations, and Level of Detail (LOD) expressions to enable deeper analysis. We’ll cover best practices for data modeling, parameter controls, dynamic filtering, and building advanced dashboards with interactive elements. You’ll also learn how to optimize performance, apply advanced sorting techniques, and design dashboards that are both functional and visually compelling.
For Custom Learning, the session will be adapted to your professional needs and goals. Whether that means working on your organization’s datasets, replicating business-specific reports, integrating Tableau with tools like Excel or SQL, or solving practical use cases in marketing, operations, sales, or finance — this session ensures your learning is relevant, hands-on, and immediately applicable.


